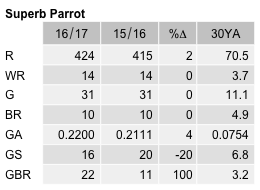
Superb Parrot
Polytelis swainsonii
ABR description
The following is extracted from the Annual Bird Report for the twelve months to June 2017.
Common, breeding summer migrant
Gradually extending its range into the ACT from western woodlands. Declared vulnerable in the ACT and NSW and under the EPBC Act.
General: Movement continues across Canberra following the initial movement into Belconnen from 2005-06. Records from 37 grid cells this year compared with 26 in 2014-15. Reporting rate 3.1% is 13% lower than last year (3.6%) representing a decline since a peak (5.1%) in 2012-13 but well above the 30YA (2.6%). Most records in summer (34%) and autumn (32%). Average 6, median 3 with max 56/22 Feb Watson (MeM2). 10 breeding records (10 last year) from di/7 Jul Isaacs GrK15 (CnM1) to dy/28 Jan Watson (MeM2).
GBS: Records from 16 sites (20 last year) from 47 weeks (20% spring, 39% summer and 32% autumn with only 9% of records in winter). Max 25/5wk Oct Murrumbateman (BlJ1), average 3.8, median 2. Abundance 4% lower than last year, arresting the continual increases since movement of birds into suburban Canberra commenced in 2005-06 (with a peak of 0.37 in 2014-15, but almost 3x the 30YA. Breeding recorded from 4 sites in Cook, Ainslie and Watson: earliest dy/2wk Dec Cook (TaN1) and last dy/1wk Mar Ainslie (HaS3).
Abundance
Abundance is the average number of birds of that species per survey. Where the species was observed (presence recorded) but the number of birds seen was not recorded, this is treated as a count of zero.
Abundance by year
This chart shows the abundance of Superb Parrot between 1982 and 2017. 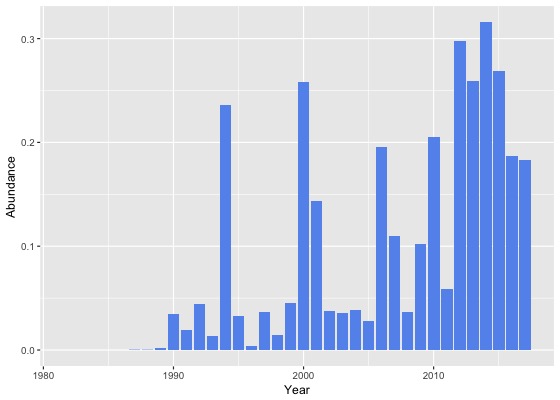
Abundance by month
This chart shows the monthly abundance of Superb Parrot. The blue lines show the abundance for the twelve months to June 2017 and the bars show the average abundance for the period 1982 to 2017. 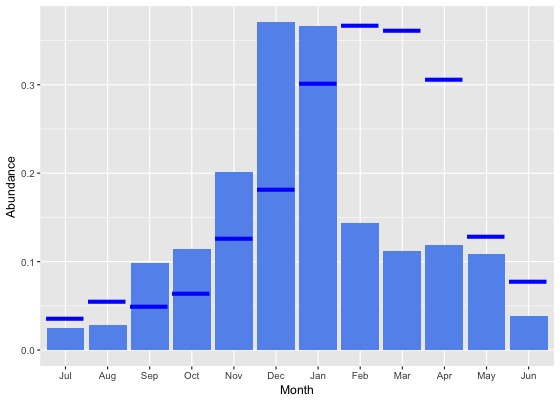
Abundance by season
This chart shows the seasonal abundance of Superb Parrot. The blue lines show the seasonal abundance for the twelve months to June 2017 and the bars show the average seasonal abundance for the period 1982 to 2017. 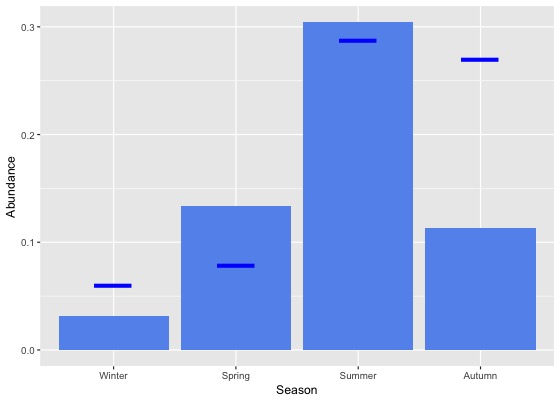
Abundance data
| Month | Season | ||||||||||||||||||
|---|---|---|---|---|---|---|---|---|---|---|---|---|---|---|---|---|---|---|---|
| Period | Jul | Aug | Sep | Oct | Nov | Dec | Jan | Feb | Mar | Apr | May | Jun | Winter | Spring | Summer | Autumn | All | ||
| All years | |||||||||||||||||||
| All | 0.0 | 0.0 | 0.1 | 0.1 | 0.2 | 0.4 | 0.4 | 0.1 | 0.1 | 0.1 | 0.1 | 0.0 | 0.0 | 0.1 | 0.3 | 0.1 | 0.2 | ||
| Previous years | |||||||||||||||||||
| All previous years | 0.0 | 0.0 | 0.1 | 0.1 | 0.2 | 0.4 | 0.4 | 0.1 | 0.1 | 0.1 | 0.1 | 0.0 | 0.0 | 0.1 | 0.3 | 0.1 | 0.1 | ||
| Previous 30 years | 0.0 | 0.0 | 0.1 | 0.1 | 0.2 | 0.4 | 0.4 | 0.1 | 0.1 | 0.1 | 0.1 | 0.0 | 0.0 | 0.1 | 0.3 | 0.1 | 0.1 | ||
| Previous 20 years | 0.0 | 0.0 | 0.1 | 0.1 | 0.3 | 0.5 | 0.4 | 0.1 | 0.1 | 0.1 | 0.1 | 0.0 | 0.0 | 0.2 | 0.4 | 0.1 | 0.2 | ||
| 10 year groups | |||||||||||||||||||
| [2007,2017) | 0.0 | 0.0 | 0.2 | 0.2 | 0.3 | 0.5 | 0.4 | 0.2 | 0.1 | 0.1 | 0.2 | 0.1 | 0.1 | 0.2 | 0.4 | 0.1 | 0.2 | ||
| [1997,2007) | 0.0 | 0.0 | 0.0 | 0.0 | 0.1 | 0.4 | 0.5 | 0.0 | 0.0 | 0.0 | 0.0 | 0.0 | 0.0 | 0.1 | 0.3 | 0.0 | 0.1 | ||
| [1987,1997) | 0.0 | 0.0 | 0.0 | 0.0 | 0.1 | 0.1 | 0.0 | 0.0 | 0.0 | 0.0 | 0.0 | 0.0 | 0.0 | 0.0 | 0.0 | 0.0 | 0.0 | ||
| 5 year groups | |||||||||||||||||||
| [2012,2017) | 0.1 | 0.1 | 0.2 | 0.2 | 0.4 | 0.6 | 0.5 | 0.2 | 0.2 | 0.2 | 0.2 | 0.1 | 0.1 | 0.2 | 0.4 | 0.2 | 0.2 | ||
| [2007,2012) | 0.0 | 0.0 | 0.1 | 0.1 | 0.2 | 0.4 | 0.2 | 0.0 | 0.0 | 0.0 | 0.0 | 0.0 | 0.0 | 0.1 | 0.2 | 0.0 | 0.1 | ||
| [2002,2007) | 0.0 | 0.0 | 0.0 | 0.0 | 0.1 | 0.1 | 0.6 | 0.0 | 0.0 | 0.0 | 0.0 | 0.0 | 0.0 | 0.0 | 0.3 | 0.0 | 0.1 | ||
| [1997,2002) | 0.0 | 0.0 | 0.1 | 0.1 | 0.2 | 0.7 | 0.3 | 0.0 | 0.0 | 0.0 | 0.0 | 0.0 | 0.0 | 0.1 | 0.4 | 0.0 | 0.1 | ||
| [1992,1997) | 0.0 | 0.0 | 0.1 | 0.1 | 0.2 | 0.2 | 0.0 | 0.0 | 0.0 | 0.1 | 0.0 | 0.0 | 0.0 | 0.1 | 0.1 | 0.0 | 0.1 | ||
| [1987,1992) | 0.0 | 0.0 | 0.0 | 0.0 | 0.0 | 0.0 | 0.1 | 0.0 | 0.0 | 0.0 | 0.0 | 0.0 | 0.0 | 0.0 | 0.0 | 0.0 | 0.0 | ||
| Year | |||||||||||||||||||
| 2017 | 0.0 | 0.1 | 0.0 | 0.1 | 0.1 | 0.2 | 0.3 | 0.4 | 0.4 | 0.3 | 0.1 | 0.1 | 0.1 | 0.1 | 0.3 | 0.3 | 0.2 | ||
| 2016 | 0.0 | 0.0 | 0.1 | 0.1 | 0.1 | 0.3 | 0.3 | 0.1 | 0.2 | 0.3 | 0.4 | 0.1 | 0.0 | 0.1 | 0.3 | 0.3 | 0.2 | ||
| 2015 | 0.1 | 0.1 | 0.2 | 0.2 | 0.2 | 0.6 | 0.5 | 0.3 | 0.2 | 0.3 | 0.2 | 0.1 | 0.1 | 0.2 | 0.5 | 0.2 | 0.3 | ||
| 2014 | 0.0 | 0.1 | 0.2 | 0.2 | 0.4 | 0.9 | 0.8 | 0.3 | 0.1 | 0.1 | 0.1 | 0.1 | 0.1 | 0.3 | 0.7 | 0.1 | 0.3 | ||
| 2013 | 0.1 | 0.1 | 0.1 | 0.2 | 0.6 | 0.7 | 0.7 | 0.0 | 0.0 | 0.0 | 0.0 | 0.1 | 0.1 | 0.3 | 0.5 | 0.0 | 0.3 | ||
| 2012 | 0.0 | 0.0 | 0.4 | 0.2 | 0.9 | 0.6 | 0.4 | 0.5 | 0.1 | 0.1 | 0.1 | 0.0 | 0.0 | 0.4 | 0.5 | 0.1 | 0.3 | ||
| 2011 | 0.1 | 0.0 | 0.0 | 0.1 | 0.2 | 0.2 | 0.1 | 0.0 | 0.0 | 0.0 | 0.0 | 0.0 | 0.0 | 0.1 | 0.1 | 0.0 | 0.1 | ||
| 2010 | 0.0 | 0.0 | 0.1 | 0.2 | 0.4 | 0.9 | 0.2 | 0.0 | 0.0 | 0.0 | 0.0 | 0.2 | 0.1 | 0.2 | 0.5 | 0.0 | 0.2 | ||
| 2009 | 0.0 | 0.0 | 0.1 | 0.2 | 0.1 | 0.3 | 0.2 | 0.0 | 0.0 | 0.0 | 0.0 | 0.0 | 0.0 | 0.2 | 0.2 | 0.0 | 0.1 | ||
| 2008 | 0.0 | 0.0 | 0.1 | 0.0 | 0.0 | 0.2 | 0.0 | 0.0 | 0.0 | 0.0 | 0.0 | 0.0 | 0.0 | 0.0 | 0.1 | 0.0 | 0.0 | ||
| 2007 | 0.0 | 0.0 | 0.1 | 0.1 | 0.5 | 0.3 | 0.2 | 0.0 | 0.0 | 0.0 | 0.0 | 0.0 | 0.0 | 0.2 | 0.2 | 0.0 | 0.1 | ||
| 2006 | 0.0 | 0.0 | 0.0 | 0.0 | 0.0 | 0.2 | 2.4 | 0.1 | 0.0 | 0.0 | 0.0 | 0.0 | 0.0 | 0.0 | 1.0 | 0.0 | 0.2 | ||
| 2005 | 0.0 | 0.0 | 0.0 | 0.0 | 0.0 | 0.1 | 0.1 | 0.0 | 0.0 | 0.0 | 0.0 | 0.0 | 0.0 | 0.0 | 0.1 | 0.0 | 0.0 | ||
| 2004 | 0.0 | 0.0 | 0.0 | 0.1 | 0.0 | 0.2 | 0.2 | 0.0 | 0.0 | 0.0 | 0.0 | 0.0 | 0.0 | 0.0 | 0.1 | 0.0 | 0.0 | ||
| 2003 | 0.0 | 0.0 | 0.0 | 0.0 | 0.0 | 0.2 | 0.1 | 0.0 | 0.0 | 0.0 | 0.0 | 0.0 | 0.0 | 0.0 | 0.1 | 0.0 | 0.0 | ||
| 2002 | 0.0 | 0.0 | 0.0 | 0.0 | 0.3 | 0.0 | 0.1 | 0.0 | 0.0 | 0.0 | 0.0 | 0.0 | 0.0 | 0.1 | 0.0 | 0.0 | 0.0 | ||
| 2001 | 0.0 | 0.0 | 0.0 | 0.0 | 0.7 | 0.6 | 0.4 | 0.0 | 0.0 | 0.0 | 0.0 | 0.0 | 0.0 | 0.2 | 0.4 | 0.0 | 0.1 | ||
| 2000 | 0.0 | 0.0 | 0.1 | 0.1 | 0.1 | 1.5 | 0.4 | 0.0 | 0.0 | 0.0 | 0.0 | 0.0 | 0.0 | 0.1 | 0.7 | 0.0 | 0.3 | ||
| 1999 | 0.0 | 0.0 | 0.0 | 0.1 | 0.1 | 0.2 | 0.1 | 0.0 | 0.0 | 0.0 | 0.0 | 0.0 | 0.0 | 0.1 | 0.1 | 0.0 | 0.0 | ||
| 1998 | 0.0 | 0.0 | 0.0 | 0.1 | 0.0 | 0.1 | 0.0 | 0.0 | 0.0 | 0.0 | 0.0 | 0.0 | 0.0 | 0.0 | 0.0 | 0.0 | 0.0 | ||
| 1997 | 0.0 | 0.0 | 0.3 | 0.0 | 0.0 | 0.0 | 0.0 | 0.0 | 0.0 | 0.0 | 0.0 | 0.0 | 0.0 | 0.1 | 0.0 | 0.0 | 0.0 | ||
| 1996 | 0.0 | 0.0 | 0.0 | 0.0 | 0.0 | 0.0 | 0.0 | 0.0 | 0.0 | 0.0 | 0.0 | 0.0 | 0.0 | 0.0 | 0.0 | 0.0 | 0.0 | ||
| 1995 | 0.0 | 0.0 | 0.1 | 0.0 | 0.0 | 0.2 | 0.1 | 0.0 | 0.0 | 0.0 | 0.0 | 0.0 | 0.0 | 0.0 | 0.1 | 0.0 | 0.0 | ||
| 1994 | 0.0 | 0.0 | 0.6 | 0.3 | 0.7 | 0.4 | 0.0 | 0.0 | 0.0 | 0.3 | 0.2 | 0.0 | 0.0 | 0.6 | 0.1 | 0.2 | 0.2 | ||
| 1993 | 0.0 | 0.0 | 0.0 | 0.0 | 0.0 | 0.2 | 0.0 | 0.0 | 0.0 | 0.0 | 0.0 | 0.0 | 0.0 | 0.0 | 0.1 | 0.0 | 0.0 | ||
| 1992 | 0.0 | 0.0 | 0.0 | 0.2 | 0.0 | 0.3 | 0.0 | 0.0 | 0.0 | 0.0 | 0.0 | 0.0 | 0.0 | 0.1 | 0.1 | 0.0 | 0.0 | ||
| 1991 | 0.0 | 0.0 | 0.0 | 0.0 | 0.0 | 0.2 | 0.0 | 0.0 | 0.0 | 0.0 | 0.0 | 0.0 | 0.0 | 0.0 | 0.1 | 0.0 | 0.0 | ||
| 1990 | 0.0 | 0.0 | 0.0 | 0.0 | 0.0 | 0.0 | 0.5 | 0.0 | 0.0 | 0.0 | 0.0 | 0.0 | 0.0 | 0.0 | 0.2 | 0.0 | 0.0 | ||
| 1989 | 0.0 | 0.0 | 0.0 | 0.0 | 0.0 | 0.0 | 0.0 | 0.0 | 0.0 | 0.0 | 0.0 | 0.0 | 0.0 | 0.0 | 0.0 | 0.0 | 0.0 | ||
| 1988 | 0.0 | 0.0 | 0.0 | 0.0 | 0.0 | 0.0 | 0.0 | 0.0 | 0.0 | 0.0 | 0.0 | 0.0 | 0.0 | 0.0 | 0.0 | 0.0 | 0.0 | ||
| 1987 | 0.0 | 0.0 | 0.0 | 0.0 | 0.0 | 0.0 | 0.0 | 0.0 | 0.0 | 0.0 | 0.0 | 0.0 | 0.0 | 0.0 | 0.0 | 0.0 | 0.0 | ||
| 1986 | 0.0 | 0.0 | 0.0 | 0.0 | 0.0 | 0.0 | 0.0 | 0.0 | 0.0 | 0.0 | 0.0 | 0.0 | 0.0 | 0.0 | 0.0 | 0.0 | 0.0 | ||
| 1985 | 0.0 | 0.0 | 0.0 | 0.0 | 0.0 | 0.0 | 0.0 | 0.0 | 0.0 | 0.0 | 0.0 | 0.0 | 0.0 | 0.0 | 0.0 | 0.0 | 0.0 | ||
| 1984 | 0.0 | 0.0 | 0.0 | 0.0 | 0.0 | 0.0 | 0.0 | 0.0 | 0.0 | 0.0 | 0.0 | 0.0 | 0.0 | 0.0 | 0.0 | 0.0 | 0.0 | ||
| 1983 | 0.0 | 0.0 | 0.0 | 0.0 | 0.0 | 0.0 | 0.0 | 0.0 | 0.0 | - | 0.0 | 0.0 | 0.0 | 0.0 | 0.0 | 0.0 | 0.0 | ||
| 1982 | - | 0.0 | - | 0.0 | 0.0 | 0.0 | - | 0.0 | - | 0.0 | - | 0.0 | 0.0 | 0.0 | 0.0 | 0.0 | 0.0 | ||
Reporting rates
Reporting rate is the proportion of all surveys in which the species was present.
Reporting rate by year
This chart shows the reporting rate of Superb Parrot each year between 1982 and 2017. 
Reporting rate by month
This chart shows the reporting rate by month of Superb Parrot. The blue lines show the reporting rate for the twelve months to June 2017 and the bars show the average reporting rate for the period 1982 to 2017. 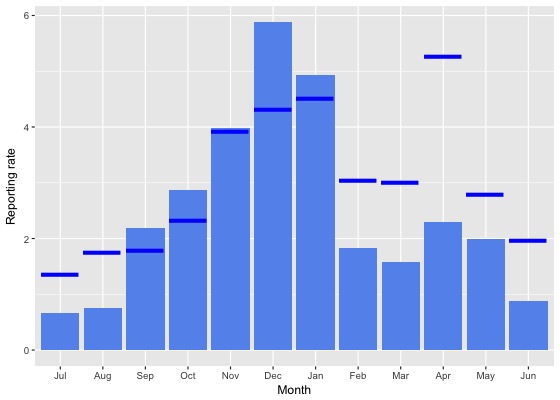
Reporting rate by season
This chart shows the seasonal reporting rate of Superb Parrot. The blue lines show the seasonal reporting rate for the twelve months to June 2017 and the bars show the average seasonal reporting rate for the period 1982 to 2017. 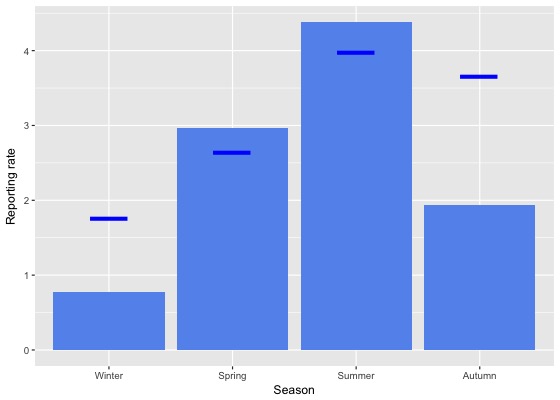
Reporting rate data
| Month | Season | ||||||||||||||||||
|---|---|---|---|---|---|---|---|---|---|---|---|---|---|---|---|---|---|---|---|
| Period | Jul | Aug | Sep | Oct | Nov | Dec | Jan | Feb | Mar | Apr | May | Jun | Winter | Spring | Summer | Autumn | All | ||
| All years | |||||||||||||||||||
| All | 0.7 | 0.8 | 2.2 | 2.9 | 4.0 | 5.9 | 4.9 | 1.8 | 1.6 | 2.3 | 2.0 | 0.9 | 0.8 | 3.0 | 4.4 | 1.9 | 2.6 | ||
| Previous years | |||||||||||||||||||
| All previous years | 0.5 | 0.6 | 2.2 | 3.0 | 4.0 | 6.1 | 5.0 | 1.6 | 1.3 | 1.8 | 1.8 | 0.7 | 0.6 | 3.0 | 4.4 | 1.6 | 2.5 | ||
| Previous 30 years | 0.6 | 0.6 | 2.3 | 3.0 | 4.1 | 6.2 | 5.1 | 1.6 | 1.3 | 1.8 | 1.8 | 0.7 | 0.6 | 3.1 | 4.5 | 1.6 | 2.6 | ||
| Previous 20 years | 0.7 | 0.8 | 2.6 | 3.4 | 5.0 | 7.1 | 5.8 | 1.9 | 1.6 | 2.1 | 2.3 | 0.8 | 0.8 | 3.5 | 5.2 | 1.9 | 3.0 | ||
| 10 year groups | |||||||||||||||||||
| [2007,2017) | 1.0 | 1.1 | 3.6 | 3.9 | 5.8 | 8.1 | 6.3 | 2.6 | 2.3 | 2.9 | 3.1 | 1.2 | 1.1 | 4.2 | 5.9 | 2.7 | 3.7 | ||
| [1997,2007) | 0.1 | 0.1 | 0.5 | 1.8 | 3.3 | 5.3 | 4.2 | 0.2 | 0.0 | 0.1 | 0.3 | 0.0 | 0.0 | 1.8 | 3.6 | 0.1 | 1.4 | ||
| [1987,1997) | 0.1 | 0.0 | 0.7 | 0.7 | 1.1 | 1.2 | 0.5 | 0.1 | 0.0 | 0.5 | 0.2 | 0.0 | 0.0 | 0.8 | 0.6 | 0.2 | 0.4 | ||
| 5 year groups | |||||||||||||||||||
| [2012,2017) | 1.1 | 1.2 | 4.1 | 4.2 | 5.9 | 8.9 | 7.1 | 3.1 | 2.8 | 4.0 | 4.0 | 1.5 | 1.3 | 4.6 | 6.5 | 3.5 | 4.3 | ||
| [2007,2012) | 1.0 | 0.5 | 2.5 | 3.2 | 5.4 | 6.3 | 3.5 | 0.6 | 0.8 | 0.4 | 0.5 | 0.6 | 0.7 | 3.4 | 4.1 | 0.6 | 2.4 | ||
| [2002,2007) | 0.1 | 0.0 | 0.1 | 1.0 | 1.8 | 2.5 | 2.7 | 0.3 | 0.1 | 0.1 | 0.5 | 0.0 | 0.0 | 0.9 | 2.0 | 0.2 | 0.8 | ||
| [1997,2002) | 0.0 | 0.2 | 1.0 | 2.9 | 5.2 | 8.9 | 5.9 | 0.0 | 0.0 | 0.0 | 0.0 | 0.0 | 0.1 | 2.9 | 5.4 | 0.0 | 2.3 | ||
| [1992,1997) | 0.3 | 0.0 | 1.8 | 1.3 | 3.0 | 2.6 | 0.5 | 0.0 | 0.0 | 1.4 | 0.3 | 0.0 | 0.1 | 2.0 | 1.1 | 0.6 | 1.0 | ||
| [1987,1992) | 0.0 | 0.0 | 0.1 | 0.3 | 0.1 | 0.5 | 0.6 | 0.1 | 0.0 | 0.0 | 0.1 | 0.0 | 0.0 | 0.2 | 0.4 | 0.0 | 0.2 | ||
| Year | |||||||||||||||||||
| 2017 | 1.4 | 1.8 | 1.8 | 2.3 | 3.9 | 4.3 | 4.5 | 3.1 | 3.0 | 5.3 | 2.8 | 2.0 | 1.8 | 2.6 | 4.0 | 3.7 | 3.1 | ||
| 2016 | 0.9 | 0.5 | 2.9 | 3.1 | 2.7 | 6.1 | 5.4 | 2.3 | 3.9 | 5.3 | 5.7 | 1.6 | 1.0 | 2.9 | 4.5 | 4.9 | 3.5 | ||
| 2015 | 1.9 | 2.0 | 4.6 | 5.9 | 5.7 | 6.7 | 7.3 | 5.0 | 3.1 | 5.0 | 4.1 | 2.2 | 2.0 | 5.4 | 6.4 | 4.0 | 4.7 | ||
| 2014 | 0.0 | 1.7 | 6.8 | 5.5 | 5.9 | 9.9 | 8.9 | 3.1 | 2.4 | 3.1 | 1.5 | 1.8 | 1.4 | 6.0 | 7.4 | 2.4 | 4.7 | ||
| 2013 | 1.4 | 0.9 | 3.4 | 2.5 | 11.3 | 14.9 | 10.4 | 1.5 | 0.8 | 1.6 | 0.8 | 1.1 | 1.1 | 5.2 | 10.1 | 1.1 | 5.1 | ||
| 2012 | 0.4 | 2.0 | 4.4 | 4.5 | 7.9 | 9.4 | 4.9 | 2.9 | 1.8 | 1.4 | 3.7 | 0.0 | 0.7 | 5.3 | 6.1 | 2.0 | 3.9 | ||
| 2011 | 3.3 | 1.6 | 1.2 | 3.8 | 4.8 | 2.4 | 3.3 | 0.9 | 0.9 | 0.3 | 0.7 | 0.0 | 1.0 | 3.3 | 2.4 | 0.7 | 1.9 | ||
| 2010 | 2.1 | 0.9 | 3.7 | 3.4 | 9.1 | 10.2 | 5.3 | 0.0 | 1.6 | 0.0 | 0.0 | 1.9 | 1.7 | 4.7 | 6.9 | 0.7 | 3.7 | ||
| 2009 | 0.0 | 0.0 | 3.4 | 4.6 | 3.1 | 7.4 | 4.7 | 1.7 | 0.9 | 0.0 | 0.8 | 0.5 | 0.2 | 4.0 | 5.0 | 0.5 | 2.7 | ||
| 2008 | 0.0 | 0.0 | 1.1 | 1.2 | 3.4 | 7.2 | 2.4 | 0.0 | 0.5 | 1.2 | 0.9 | 0.5 | 0.2 | 1.5 | 4.2 | 1.0 | 1.6 | ||
| 2007 | 0.0 | 0.0 | 3.3 | 3.2 | 6.1 | 5.7 | 2.4 | 0.0 | 0.0 | 0.0 | 0.0 | 0.3 | 0.2 | 3.7 | 3.4 | 0.0 | 2.1 | ||
| 2006 | 0.0 | 0.0 | 0.0 | 1.0 | 1.8 | 4.5 | 6.2 | 1.5 | 0.3 | 0.0 | 0.7 | 0.0 | 0.0 | 0.9 | 4.3 | 0.3 | 1.2 | ||
| 2005 | 0.7 | 0.0 | 0.0 | 0.0 | 1.4 | 2.4 | 1.4 | 0.0 | 0.0 | 0.5 | 1.0 | 0.0 | 0.2 | 0.3 | 1.7 | 0.5 | 0.6 | ||
| 2004 | 0.0 | 0.0 | 0.0 | 3.5 | 1.2 | 1.8 | 2.4 | 0.0 | 0.0 | 0.0 | 0.0 | 0.0 | 0.0 | 1.4 | 1.7 | 0.0 | 0.8 | ||
| 2003 | 0.0 | 0.0 | 0.0 | 0.5 | 1.4 | 4.2 | 1.5 | 0.0 | 0.0 | 0.0 | 0.0 | 0.0 | 0.0 | 0.6 | 2.2 | 0.0 | 0.7 | ||
| 2002 | 0.0 | 0.0 | 0.5 | 0.4 | 3.0 | 0.9 | 1.3 | 0.0 | 0.0 | 0.0 | 0.0 | 0.0 | 0.0 | 1.3 | 0.8 | 0.0 | 0.6 | ||
| 2001 | 0.0 | 0.0 | 0.9 | 1.3 | 12.5 | 9.4 | 2.5 | 0.0 | 0.0 | 0.0 | 0.0 | 0.0 | 0.0 | 3.7 | 4.6 | 0.0 | 2.2 | ||
| 2000 | 0.0 | 0.7 | 0.9 | 4.8 | 4.2 | 17.1 | 11.2 | 0.0 | 0.0 | 0.0 | 0.0 | 0.0 | 0.2 | 3.3 | 10.4 | 0.0 | 4.1 | ||
| 1999 | 0.0 | 0.0 | 0.6 | 3.8 | 3.2 | 3.8 | 6.6 | 0.0 | 0.0 | 0.0 | 0.0 | 0.0 | 0.0 | 2.5 | 3.4 | 0.0 | 1.5 | ||
| 1998 | 0.0 | 0.0 | 0.0 | 1.1 | 0.9 | 0.9 | 0.0 | 0.0 | 0.0 | 0.0 | 0.0 | 0.0 | 0.0 | 0.6 | 0.4 | 0.0 | 0.3 | ||
| 1997 | 0.0 | 0.0 | 3.6 | 2.6 | 2.6 | 0.0 | 0.0 | 0.0 | 0.0 | 0.0 | 0.0 | 0.0 | 0.0 | 3.0 | 0.0 | 0.0 | 1.0 | ||
| 1996 | 0.0 | 0.0 | 0.0 | 1.8 | 0.0 | 0.0 | 0.0 | 0.0 | 0.0 | 0.0 | 0.0 | 0.0 | 0.0 | 0.7 | 0.0 | 0.0 | 0.2 | ||
| 1995 | 1.1 | 0.0 | 1.0 | 0.0 | 1.8 | 3.4 | 0.9 | 0.0 | 0.0 | 0.0 | 0.0 | 0.0 | 0.3 | 0.8 | 1.5 | 0.0 | 0.6 | ||
| 1994 | 0.0 | 0.0 | 7.4 | 3.5 | 9.6 | 8.7 | 1.5 | 0.0 | 0.0 | 3.8 | 1.2 | 0.0 | 0.0 | 7.2 | 2.9 | 2.0 | 3.3 | ||
| 1993 | 0.0 | 0.0 | 1.6 | 1.3 | 0.0 | 2.2 | 0.0 | 0.0 | 0.0 | 1.7 | 0.0 | 0.0 | 0.0 | 1.0 | 0.8 | 0.5 | 0.5 | ||
| 1992 | 0.0 | 0.0 | 0.0 | 1.1 | 0.0 | 1.6 | 0.0 | 0.0 | 0.0 | 0.0 | 0.0 | 0.0 | 0.0 | 0.4 | 0.6 | 0.0 | 0.3 | ||
| 1991 | 0.0 | 0.0 | 0.0 | 1.0 | 0.0 | 1.4 | 0.0 | 0.0 | 0.0 | 0.0 | 1.6 | 0.0 | 0.0 | 0.3 | 0.6 | 0.5 | 0.3 | ||
| 1990 | 0.0 | 0.0 | 0.0 | 0.0 | 0.0 | 1.4 | 5.6 | 0.0 | 0.0 | 0.0 | 0.0 | 0.0 | 0.0 | 0.0 | 2.3 | 0.0 | 0.4 | ||
| 1989 | 0.0 | 0.0 | 0.4 | 0.4 | 0.5 | 0.9 | 0.0 | 0.0 | 0.0 | 0.0 | 0.0 | 0.0 | 0.0 | 0.4 | 0.3 | 0.0 | 0.2 | ||
| 1988 | 0.0 | 0.0 | 0.0 | 0.0 | 0.0 | 0.0 | 0.0 | 0.6 | 0.0 | 0.0 | 0.0 | 0.0 | 0.0 | 0.0 | 0.2 | 0.0 | 0.0 | ||
| 1987 | 0.0 | 0.0 | 0.0 | 0.4 | 0.0 | 0.0 | 0.0 | 0.0 | 0.0 | 0.0 | 0.0 | 0.0 | 0.0 | 0.1 | 0.0 | 0.0 | 0.0 | ||
| 1986 | 0.0 | 0.0 | 0.0 | 0.0 | 0.0 | 0.0 | 0.0 | 0.0 | 0.0 | 0.0 | 0.0 | 0.0 | 0.0 | 0.0 | 0.0 | 0.0 | 0.0 | ||
| 1985 | 0.0 | 0.0 | 0.0 | 0.0 | 0.0 | 0.0 | 0.0 | 0.0 | 0.0 | 0.0 | 0.0 | 0.0 | 0.0 | 0.0 | 0.0 | 0.0 | 0.0 | ||
| 1984 | 0.0 | 0.0 | 0.0 | 0.0 | 0.0 | 0.0 | 0.0 | 0.0 | 0.0 | 0.0 | 0.0 | 0.0 | 0.0 | 0.0 | 0.0 | 0.0 | 0.0 | ||
| 1983 | 0.0 | 0.0 | 0.0 | 0.0 | 0.0 | 0.0 | 0.0 | 0.0 | 0.0 | - | 0.0 | 0.0 | 0.0 | 0.0 | 0.0 | 0.0 | 0.0 | ||
| 1982 | - | 0.0 | - | 0.0 | 0.0 | 0.0 | - | 0.0 | - | 0.0 | - | 0.0 | 0.0 | 0.0 | 0.0 | 0.0 | 0.0 | ||
Breeding data
Breeding records by month
Number of breeding records by breeding code and month, 2017 and all years| Breeding code | Jul | Aug | Sep | Oct | Nov | Dec | Jan | Feb | Mar | Apr | May | Jun |
|---|---|---|---|---|---|---|---|---|---|---|---|---|
| 2017 | ||||||||||||
| Breeding (BLA code) | 0 | 0 | 0 | 0 | 0 | 0 | 0 | 0 | 0 | 0 | 0 | 0 |
| Carrying Food | 0 | 0 | 0 | 0 | 0 | 0 | 0 | 0 | 0 | 0 | 0 | 0 |
| Copulating | 0 | 0 | 0 | 0 | 0 | 0 | 0 | 0 | 0 | 0 | 0 | 0 |
| Display | 1 | 0 | 0 | 0 | 0 | 1 | 0 | 0 | 0 | 0 | 0 | 0 |
| Dependent young | 0 | 0 | 0 | 0 | 1 | 3 | 5 | 0 | 0 | 0 | 0 | 0 |
| Faecal sac | 0 | 0 | 0 | 0 | 0 | 0 | 0 | 0 | 0 | 0 | 0 | 0 |
| Inspecting hollow | 0 | 0 | 0 | 0 | 0 | 0 | 0 | 0 | 0 | 0 | 0 | 0 |
| Nest building | 0 | 0 | 0 | 0 | 0 | 0 | 0 | 0 | 0 | 0 | 0 | 0 |
| Nest with eggs | 0 | 0 | 0 | 0 | 0 | 0 | 0 | 0 | 0 | 0 | 0 | 0 |
| Nest with young | 0 | 0 | 0 | 0 | 0 | 0 | 0 | 0 | 0 | 0 | 0 | 0 |
| On/leaving nest | 0 | 0 | 0 | 0 | 0 | 0 | 0 | 0 | 0 | 0 | 0 | 0 |
| All years | ||||||||||||
| Breeding (BLA code) | 0 | 0 | 0 | 0 | 1 | 0 | 2 | 0 | 0 | 0 | 0 | 0 |
| Carrying Food | 0 | 0 | 0 | 0 | 0 | 1 | 0 | 0 | 0 | 0 | 0 | 0 |
| Copulating | 0 | 0 | 0 | 0 | 0 | 0 | 0 | 0 | 0 | 0 | 0 | 0 |
| Display | 1 | 0 | 0 | 1 | 0 | 1 | 0 | 0 | 0 | 0 | 0 | 0 |
| Dependent young | 0 | 0 | 0 | 0 | 2 | 67 | 44 | 3 | 0 | 0 | 0 | 0 |
| Faecal sac | 0 | 0 | 0 | 0 | 0 | 0 | 0 | 0 | 0 | 0 | 0 | 0 |
| Inspecting hollow | 0 | 0 | 5 | 8 | 13 | 3 | 0 | 0 | 0 | 0 | 0 | 0 |
| Nest building | 0 | 0 | 0 | 0 | 0 | 0 | 0 | 0 | 0 | 0 | 0 | 0 |
| Nest with eggs | 0 | 0 | 0 | 0 | 0 | 0 | 0 | 0 | 0 | 0 | 0 | 0 |
| Nest with young | 0 | 0 | 0 | 0 | 0 | 1 | 0 | 0 | 0 | 0 | 0 | 0 |
| On/leaving nest | 0 | 0 | 0 | 1 | 1 | 2 | 0 | 0 | 0 | 0 | 0 | 0 |
Breeding records by year
Average number of breeding records per period by breeding code| Period | Breeding (BLA code) | Carrying Food | Copulating | Display | Dependent young | Faecal sac | Inspecting hollow | Nest building | Nest with eggs | Nest with young | On/leaving nest |
|---|---|---|---|---|---|---|---|---|---|---|---|
| All years | |||||||||||
| All | 0.1 | 0.0 | 0.0 | 0.1 | 3.2 | 0.0 | 0.8 | 0.0 | 0.0 | 0.0 | 0.1 |
| Previous years | |||||||||||
| All previous years | 0.1 | 0.0 | 0.0 | 0.0 | 3.1 | 0.0 | 0.8 | 0.0 | 0.0 | 0.0 | 0.1 |
| Previous 30 years | 0.1 | 0.0 | 0.0 | 0.0 | 3.6 | 0.0 | 1.0 | 0.0 | 0.0 | 0.0 | 0.1 |
| Previous 20 years | 0.1 | 0.0 | 0.0 | 0.0 | 5.2 | 0.0 | 1.4 | 0.0 | 0.0 | 0.0 | 0.2 |
| 10 year groups | |||||||||||
| [2007,2017) | 0.2 | 0.0 | 0.0 | 0.1 | 4.9 | 0.0 | 2.4 | 0.0 | 0.0 | 0.0 | 0.2 |
| [1997,2007) | 0.1 | 0.1 | 0.0 | 0.0 | 5.5 | 0.0 | 0.5 | 0.0 | 0.0 | 0.1 | 0.2 |
| [1987,1997) | 0.0 | 0.0 | 0.0 | 0.0 | 0.3 | 0.0 | 0.0 | 0.0 | 0.0 | 0.0 | 0.0 |
| 5 year groups | |||||||||||
| [2012,2017) | 0.4 | 0.0 | 0.0 | 0.0 | 7.8 | 0.0 | 3.0 | 0.0 | 0.0 | 0.0 | 0.2 |
| [2007,2012) | 0.0 | 0.0 | 0.0 | 0.2 | 2.0 | 0.0 | 1.8 | 0.0 | 0.0 | 0.0 | 0.2 |
| [2002,2007) | 0.0 | 0.2 | 0.0 | 0.0 | 2.8 | 0.0 | 0.0 | 0.0 | 0.0 | 0.0 | 0.0 |
| [1997,2002) | 0.2 | 0.0 | 0.0 | 0.0 | 8.2 | 0.0 | 1.0 | 0.0 | 0.0 | 0.2 | 0.4 |
| [1992,1997) | 0.0 | 0.0 | 0.0 | 0.0 | 0.0 | 0.0 | 0.0 | 0.0 | 0.0 | 0.0 | 0.0 |
| [1987,1992) | 0.0 | 0.0 | 0.0 | 0.0 | 0.6 | 0.0 | 0.0 | 0.0 | 0.0 | 0.0 | 0.0 |
| Year | |||||||||||
| 2017 | 0.0 | 0.0 | 0.0 | 2.0 | 9.0 | 0.0 | 0.0 | 0.0 | 0.0 | 0.0 | 0.0 |
| 2016 | 0.0 | 0.0 | 0.0 | 0.0 | 7.0 | 0.0 | 2.0 | 0.0 | 0.0 | 0.0 | 1.0 |
| 2015 | 0.0 | 0.0 | 0.0 | 0.0 | 16.0 | 0.0 | 0.0 | 0.0 | 0.0 | 0.0 | 0.0 |
| 2014 | 0.0 | 0.0 | 0.0 | 0.0 | 10.0 | 0.0 | 2.0 | 0.0 | 0.0 | 0.0 | 0.0 |
| 2013 | 0.0 | 0.0 | 0.0 | 0.0 | 4.0 | 0.0 | 1.0 | 0.0 | 0.0 | 0.0 | 0.0 |
| 2012 | 2.0 | 0.0 | 0.0 | 0.0 | 2.0 | 0.0 | 10.0 | 0.0 | 0.0 | 0.0 | 0.0 |
| 2011 | 0.0 | 0.0 | 0.0 | 0.0 | 2.0 | 0.0 | 1.0 | 0.0 | 0.0 | 0.0 | 0.0 |
| 2010 | 0.0 | 0.0 | 0.0 | 1.0 | 3.0 | 0.0 | 4.0 | 0.0 | 0.0 | 0.0 | 1.0 |
| 2009 | 0.0 | 0.0 | 0.0 | 0.0 | 1.0 | 0.0 | 2.0 | 0.0 | 0.0 | 0.0 | 0.0 |
| 2008 | 0.0 | 0.0 | 0.0 | 0.0 | 2.0 | 0.0 | 0.0 | 0.0 | 0.0 | 0.0 | 0.0 |
| 2007 | 0.0 | 0.0 | 0.0 | 0.0 | 2.0 | 0.0 | 2.0 | 0.0 | 0.0 | 0.0 | 0.0 |
| 2006 | 0.0 | 0.0 | 0.0 | 0.0 | 8.0 | 0.0 | 0.0 | 0.0 | 0.0 | 0.0 | 0.0 |
| 2005 | 0.0 | 0.0 | 0.0 | 0.0 | 3.0 | 0.0 | 0.0 | 0.0 | 0.0 | 0.0 | 0.0 |
| 2004 | 0.0 | 1.0 | 0.0 | 0.0 | 1.0 | 0.0 | 0.0 | 0.0 | 0.0 | 0.0 | 0.0 |
| 2003 | 0.0 | 0.0 | 0.0 | 0.0 | 2.0 | 0.0 | 0.0 | 0.0 | 0.0 | 0.0 | 0.0 |
| 2002 | 0.0 | 0.0 | 0.0 | 0.0 | 0.0 | 0.0 | 0.0 | 0.0 | 0.0 | 0.0 | 0.0 |
| 2001 | 0.0 | 0.0 | 0.0 | 0.0 | 2.0 | 0.0 | 4.0 | 0.0 | 0.0 | 1.0 | 2.0 |
| 2000 | 0.0 | 0.0 | 0.0 | 0.0 | 37.0 | 0.0 | 0.0 | 0.0 | 0.0 | 0.0 | 0.0 |
| 1999 | 1.0 | 0.0 | 0.0 | 0.0 | 2.0 | 0.0 | 0.0 | 0.0 | 0.0 | 0.0 | 0.0 |
| 1998 | 0.0 | 0.0 | 0.0 | 0.0 | 0.0 | 0.0 | 0.0 | 0.0 | 0.0 | 0.0 | 0.0 |
| 1997 | 0.0 | 0.0 | 0.0 | 0.0 | 0.0 | 0.0 | 1.0 | 0.0 | 0.0 | 0.0 | 0.0 |
| 1996 | 0.0 | 0.0 | 0.0 | 0.0 | 0.0 | 0.0 | 0.0 | 0.0 | 0.0 | 0.0 | 0.0 |
| 1995 | 0.0 | 0.0 | 0.0 | 0.0 | 0.0 | 0.0 | 0.0 | 0.0 | 0.0 | 0.0 | 0.0 |
| 1994 | 0.0 | 0.0 | 0.0 | 0.0 | 0.0 | 0.0 | 0.0 | 0.0 | 0.0 | 0.0 | 0.0 |
| 1993 | 0.0 | 0.0 | 0.0 | 0.0 | 0.0 | 0.0 | 0.0 | 0.0 | 0.0 | 0.0 | 0.0 |
| 1992 | 0.0 | 0.0 | 0.0 | 0.0 | 0.0 | 0.0 | 0.0 | 0.0 | 0.0 | 0.0 | 0.0 |
| 1991 | 0.0 | 0.0 | 0.0 | 0.0 | 1.0 | 0.0 | 0.0 | 0.0 | 0.0 | 0.0 | 0.0 |
| 1990 | 0.0 | 0.0 | 0.0 | 0.0 | 1.0 | 0.0 | 0.0 | 0.0 | 0.0 | 0.0 | 0.0 |
| 1989 | 0.0 | 0.0 | 0.0 | 0.0 | 1.0 | 0.0 | 0.0 | 0.0 | 0.0 | 0.0 | 0.0 |
| 1988 | 0.0 | 0.0 | 0.0 | 0.0 | 0.0 | 0.0 | 0.0 | 0.0 | 0.0 | 0.0 | 0.0 |
| 1987 | 0.0 | 0.0 | 0.0 | 0.0 | 0.0 | 0.0 | 0.0 | 0.0 | 0.0 | 0.0 | 0.0 |
| 1986 | 0.0 | 0.0 | 0.0 | 0.0 | 0.0 | 0.0 | 0.0 | 0.0 | 0.0 | 0.0 | 0.0 |
| 1985 | 0.0 | 0.0 | 0.0 | 0.0 | 0.0 | 0.0 | 0.0 | 0.0 | 0.0 | 0.0 | 0.0 |
| 1984 | 0.0 | 0.0 | 0.0 | 0.0 | 0.0 | 0.0 | 0.0 | 0.0 | 0.0 | 0.0 | 0.0 |
| 1983 | 0.0 | 0.0 | 0.0 | 0.0 | 0.0 | 0.0 | 0.0 | 0.0 | 0.0 | 0.0 | 0.0 |
| 1982 | 0.0 | 0.0 | 0.0 | 0.0 | 0.0 | 0.0 | 0.0 | 0.0 | 0.0 | 0.0 | 0.0 |
Distribution map
Distribution - 2017
This map shows the observed distribution of the Superb Parrot for 2017.
The red circles are the grid cells where Superb Parrot have been reported.
The transparency of the red circles indicate how many surveys sheets were submitted for that grid cell; the darker the red the more reliable the data. Of the 315 grid cells with reports, 83 had only one sheet; an example is grid number A11.
The size of the circle represents the reporting rate. The maximum reporting rate for Superb Parrot was 33.3% (eg grid number C2) and the minimum was 0.2% (eg grid number K14). 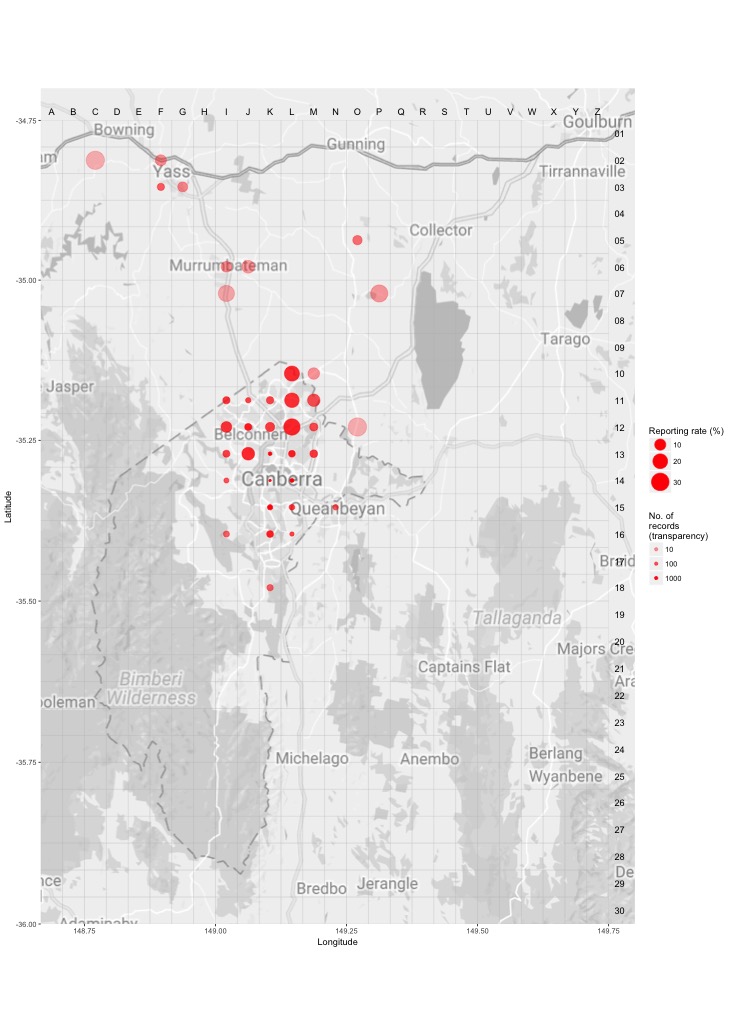
Distribution - all years
This map shows the observed distribution of the Superb Parrot for all years.
The red circles are the grid cells where Superb Parrot have been reported.
The transparency of the red circles indicate how many surveys sheets were submitted for that grid cell; the darker the red the more reliable the data. Of the 703 grid cells with reports, 55 had only one sheet; an example is grid number A12.
The size of the circle represents the reporting rate. The maximum reporting rate for Superb Parrot was 61.1% (eg grid number H5) and the minimum was 0.1% (eg grid number J16). 
Breeding map
Breeding - 2017
This map shows the breeding distribution of the Superb Parrot for 2017.
The red circles are the grid cells where breeding activity for Superb Parrot have been reported.
The size of the circle represents the number of reports. 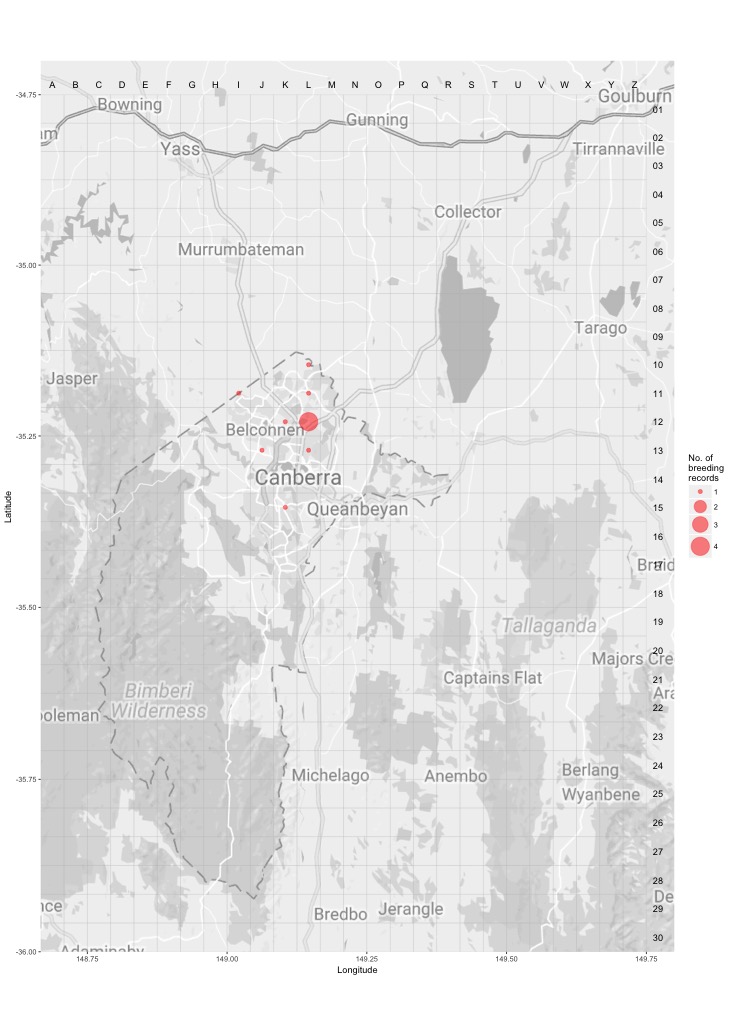
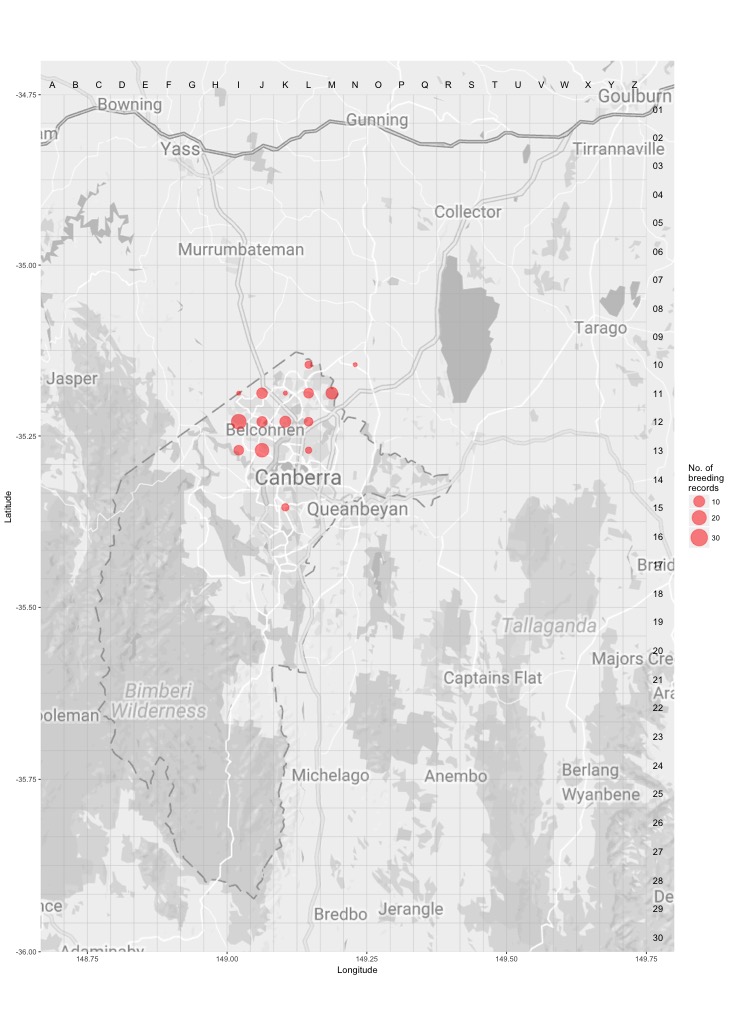
Breeding - all years
This map shows the breeding distribution of the Superb Parrot for all years.
The red circles are the grid cells where breeding activity for Superb Parrot have been reported.
The size of the circle represents the number of reports.